

Run your shop
Analytics & reports
Revenue, profit, best sellers and the true value of your stock.
Live sample — click around, nothing is saved
ETB 12,165
vs previous period
−ETB 8,594
Gross margin 33.3%
30
ETB 405
5
ETB 20,760
Sales Trend
Total ETB 12,166 · Best day Oct 9 · ETB 5,595
● Online● In-store / POS
Top Products
Four tabs#
| Tab | Answers |
|---|---|
| Overview | How is the business doing? Revenue, net profit, orders, average order, new customers, expenses, sales trend and top products. |
| Product Report | Which sales earned what? Line-by-line sales with cost, revenue, VAT and profit. |
| Stock Performance | What is my stock worth, and what moves? |
| Employee Performance | Who sells how much? |
Overview#
- Net profit subtracts expenses from gross profit, so a month with big rent shows a loss even if sales were good.
- Sales trend is a bar chart of revenue per day, split into online and in-store.
- Top products ranks by revenue with a share-of-sales bar.
- Use the period and warehouse filters at the top.
Product report#
Live sample — click around, nothing is saved
| Product | Date | Cost | Sold | Revenue | Profit | Units |
|---|---|---|---|---|---|---|
| Apple iPhone 14 | Oct 9 | ETB 700 | ETB 999 | ETB 999 | ETB 299 | 1 |
| Nike Air Jordan 1 | Oct 9 | ETB 90 | ETB 150 | ETB 150 | ETB 60 | 1 |
| Adidas Ultraboost 22 | Oct 8 | ETB 100 | ETB 180 | ETB 360 | ETB 160 | 2 |
| Levi's 501 Jeans | Oct 8 | ETB 60 | ETB 135 | ETB 135 | ETB 75 | 1 |
- Filter by category, receipt (with or without), VAT, customer, revenue and warehouse.
- Cards on top total revenue, profit before expenses, units sold, revenue without VAT, expenses and withholding.
- Press Export for a spreadsheet.
Stock performance#
Live sample — click around, nothing is saved
184
ETB 33,915
ETB 11,262
ETB 3,456
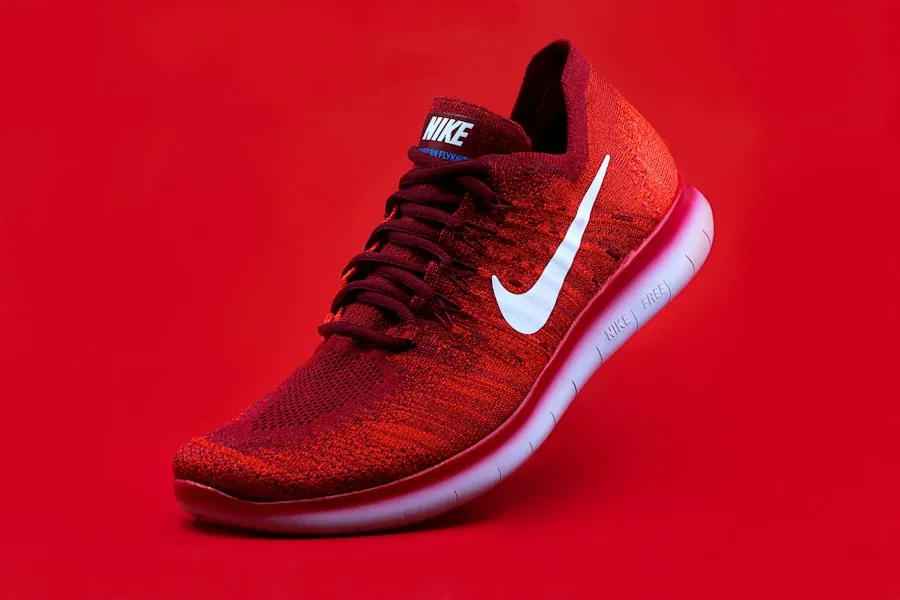 Nike Air Jordan 138
in stock
 Apple iPhone 1420
in stock
 Sony WH-1000XM5 Headphones12
in stock
 Puma Smash Sneakers4
in stock
 Samsung Galaxy S2315
in stock
- In stock, cost (exact batches) and sales value show what your shelves are worth.
- Switch between All products, Sold and Unsold to find what is not moving.
- Use it to decide what to reorder.
Employee performance#
The Employee Performance tab ranks your team for the chosen period. For each person it shows total sales, orders, average order and a small trend, plus a breakdown table you can sort by Total sales, Orders or Average order. Orders sold by the owner are included, so you can compare yourself with staff.
Choosing the dates#
Pick a period (for example the last 30 days) at the top of Analytics. Every card, chart and report on the page follows it, including Employee Performance.
Words used on the cards#
| Card | Meaning |
|---|---|
| Total revenue | Everything sold in the period, VAT included. |
| Net profit | Gross profit minus expenses. Gross profit is revenue minus the cost of the batches sold. |
| Gross margin | Profit as a percentage of revenue. |
| Average order | Revenue divided by the number of orders. |
| New customers | Customers added in the period. |
| Total expenses | Everything you recorded as an expense, including salaries. |